The following illustrates the proceeding from getting an appropriate input file for working with ParSeMiS to the post-processing for image files of the patterns found. For every step the bash command line is used to invoke scripts and tools.
First, you have to query MaSyMoS to get the existing reaction networks of all SBML models as json-file, for example by using the tool curl.
1 | curl -X POST -d '{ "query": "MATCH (r:SBML_REACTION)-[h]->(s:SBML_SPECIES) RETURN h", "params": {} }' https://sems.uni-rostock.de:7474/db/data/cypher -H "Content-Type: application/json" > resultHttp.json |
Irrelevant data such as the http adresses are deleted from the resulting json-file by using the tools awk and sed.
As input for ParSeMiS a dot-file is needed. Therefore, the json-file gets converted into dot-format by a self written php-script:
1 2 3 4 5 6 7 8 9 10 11 12 13 14 15 16 17 | $json = json_decode (file_get_contents ("reactionNetworks.json")); $returns = $json->data; echo "digraph { \n"; foreach ($returns as $r) { echo $r[0]->start . " [label="SBML_REACTION"];" . "\n"; echo $r[0]->end . " [label="SBML_SPECIES"];" . "\n"; if ( $r[0]->type == "HAS_REACTANT") { echo $r[0]->end . " -> " . $r[0]->start . " [label="IS_REACTANT"];" . "\n"; } elseif ( $r[0]->type == "HAS_MODIFIER") { echo $r[0]->end . " -> " . $r[0]->start . " [label="IS_MODIFIER"];" . "\n"; } else { echo $r[0]->start . " -> " . $r[0]->end . " [label="" . $r[0]->type . ""];" . "\n"; } } echo "} \n"; |
This creates one big graph with all nodes and edges that were contained in the json-file.
Because the nodes from different models are unconnected, it is necessary to split the big graph into its unconnected subgraphs. You can create a new dot-file with all unconnected graphs by using the tool ccomps. This file can then be used as input for ParSeMiS. The following is an example call of ParSeMiS, where the name of the input file is “allReactionnetworks.dot” and the required frequency is set to 60%.
1 | java -jar ParSeMiS.jar --graphFile=allReactionnetworks.dot --outputFile=fragments.dot --minimumFrequency=60% |
The output is a dot file, which contains all the patterns fulfilling the given frequency threshold.
You can add appearence properties to the found patterns by using the tool sed.
Finally, we split the file in separate files with the tool csplit and create an image file for each pattern with the dot tool.
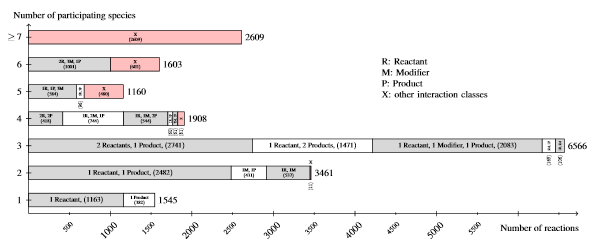
Listing of the node degree for reaction nodes in the data set R29 of curated models in BioModels Database. For each number of species (from 1 to 6, and more than 6) participating an reaction, the figure lists the number of reaction nodes identified with a particular combination of its species relations (interaction class). The figure sums up smaller interaction classes displayed by X. It becomes obvious that most reactions have two or three participating species.
We analyzed Release~29 of BioModels Database (in the following referred to as R29) containing 575 curated models and, in addition, compared the results to BioModels first release containing only 30 curated models (in the following referred to as R1).
Each reaction or species belongs to exactly one SBML-model. For R29 there exist 18852 reaction nodes and 16843 species nodes in total.
Compared with the first release (R1), the rapid growth of models becomes obvious.
Data set R1 contains only 30 curated models having 736 reactions and 425 species, respectively.
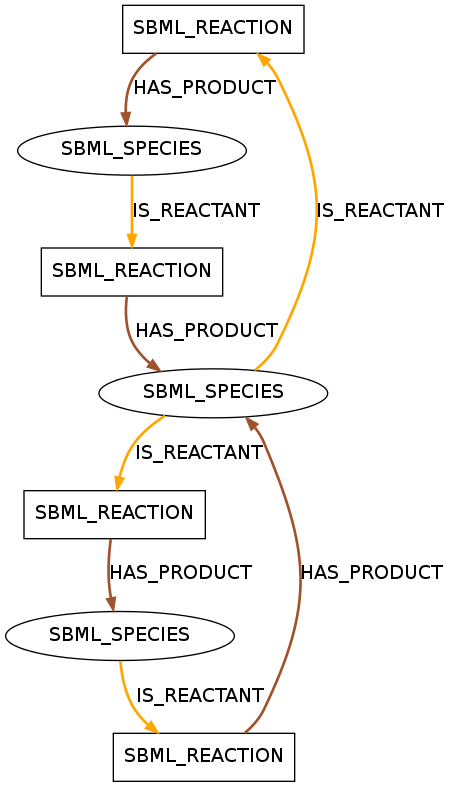
You can find examples of the resulting patterns below.
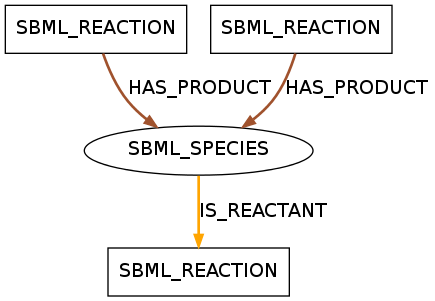
The displayed pattern was found in 390 models of data set R29 and in 26 models of data set R1. It shows a species that takes a role as a reactant in one reaction and as a product in two reactions.
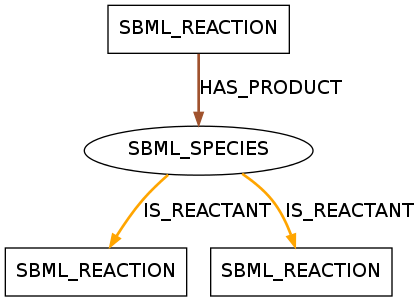
The displayed pattern was found in 436 models of data set R29 and 28 models of data set R1. It shows a species that takes a role as a reactant in two reactions and as a product in one reaction.

This pattern occurred in 351 models of data set R29 and shows a species taking part in a reaction as a reactant and a modifier.
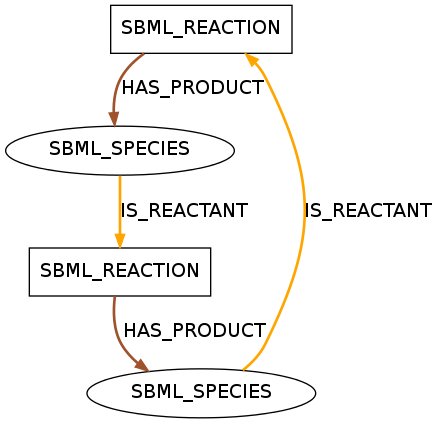
This pattern shows the smallest biologically meaningful circle. It is contained in 330 models of data set R29 and in 25 models of data set R1.
A pattern with seven entities containing two circles. This pattern is included in 21 models of R1.

A pattern with ten entities containing two branches. This pattern is the biggest pattern that is not a chain.